


Bear markets are times of uncertainty for investors as the market resets its parameters and preferences to determine stock values. While top-line growth momentum and high expectations are relished in bull markets, it get replaced by tangible value and stability during bear markets. The most tangible asset that a company can possess is cash. In basic terms, a stock trading under its cash amount is perceived as undervalued. This can provide an upside on a recovery as well as stability from falling much further. When looking for trading or investing candidates, this can be a starting point before applying any further technical and fundamental analysis to determine if its right for your portfolio.

MarketBeat.com – MarketBeat
Cash-Per-Share
The cash-per-share usually tends to be a floor as far as a stock price can fall. Theoretically, if a stock trades under its cash-per-share value, you’re getting the business for free. Fundamentally, there is usually a problem with the operations or strategy that caused the sell-off in shares below the cash value. In fact, in most cases, the underlying stock is a speculator’s bet. Of course, many businesses aren’t worth the paper the stock is printed on, but the cash makes it viable. Additionally, undervalued stocks can attract the attention of arbs and potential acquirers. It’s the perception of value that becomes a self-fulfilling prophecy at times.
How to Screen for CPS Value Stocks
This requires using a stock screener that allows you to find stocks trading at or under CPS as in “CPS>Stock Price” or a variable of Stock Price as a Ratio to Cash. You can find a free fundamental screener at Finviz.com. For example, a Price-to-Cash (PTC or P/C) ratio of over 1 means the stock is trading higher than the CPS. A PTC of over 2 means the stock is trading twice as much as the CPS. When scanning for CPS value, the setting should be Price/Cash (PTC) less than < 1.
Filtering Through P/C<1 Stocks
This scan will find numerous stocks that fit this formula. The key is to continue filtering down the candidates. Since liquidity is important, you can adjust the list to prioritize the highest daily trading volume. You can also filter by price/earnings (P/E) and keep adding to the filters to arrive at a handful before applying technical analysis. Stick to stocks that service the USA, so FX rates and volatility doesn’t apply. Avoid China names since the numbers can’t be verified. Additional filters can include positive sales growth and low long-term debt.
CPS Doesn’t Apply with Financials
It’s worth noting that financial stocks including banks, wealth management firms, insurers or REITs should be avoided when using the CPS valuations. This is largely because many times, the company is just holding the cash for clients or customers and is not technically theirs to spend.
Be Aware of the Sector Pressures and Debt
Some sectors may be under pressure and have depressed CPS values across the board. For example, airline stocks were crushed as an epicenter industry during the pandemic and continue to trade well below cash value. Therefore, it’s important to note whether certain sectors or industries are fundamentally under pressure as a group. The airline industry is known for tremendous debt, which is why shares have been trading under CPS values. The rare gems are stocks that show profitability (P/E) trading under its CPS (P/C<1).
Apply Fundamental Metrics
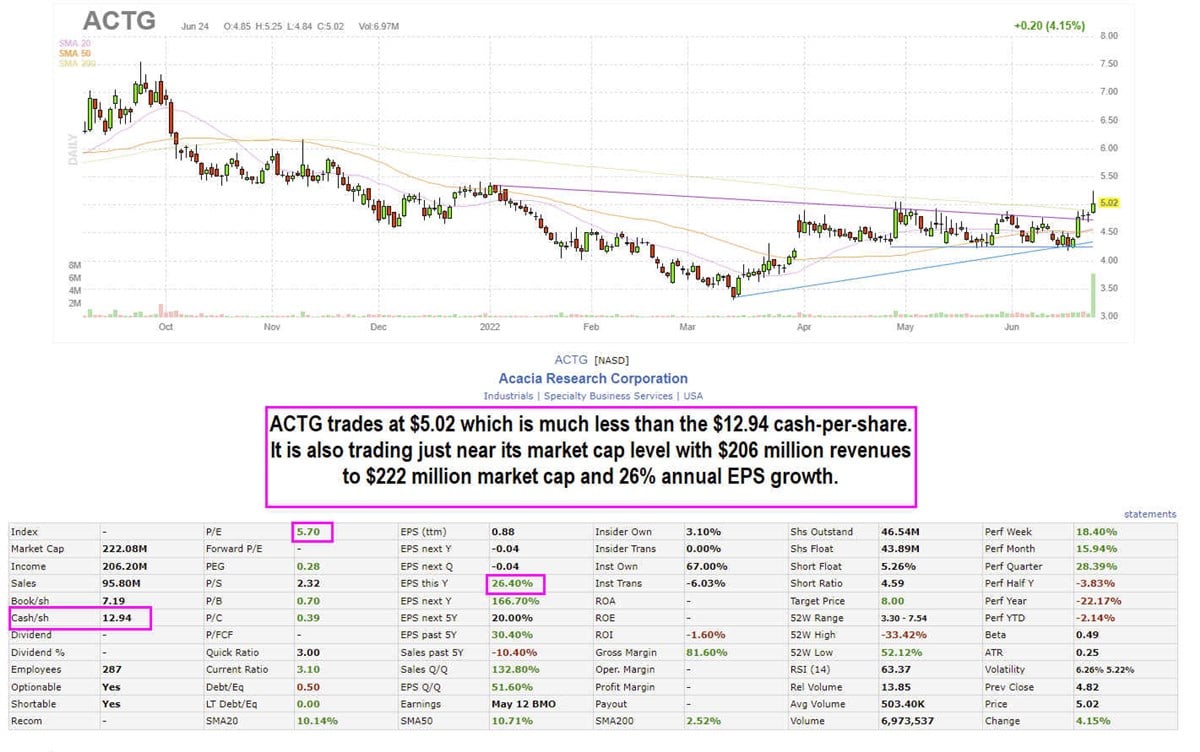
Once you find the handful of stocks that meet the criteria, then it’s a good idea to research them both fundamentally and apply technical analysis using charts. Acacia Research Corporation (NASDAQ: ACTG) stock trades at $5.02 versus its $12.94 cash-per-share. It’s profitable with a 5.7 P/E and nearly 7 million shares daily volume recently. It’s market cap is just above its sales level and shows positive EPS growth of 26.4%. It looks fundamentally undervalued.
Apply Technical Analysis to Find Opportunistic Pullback Levels
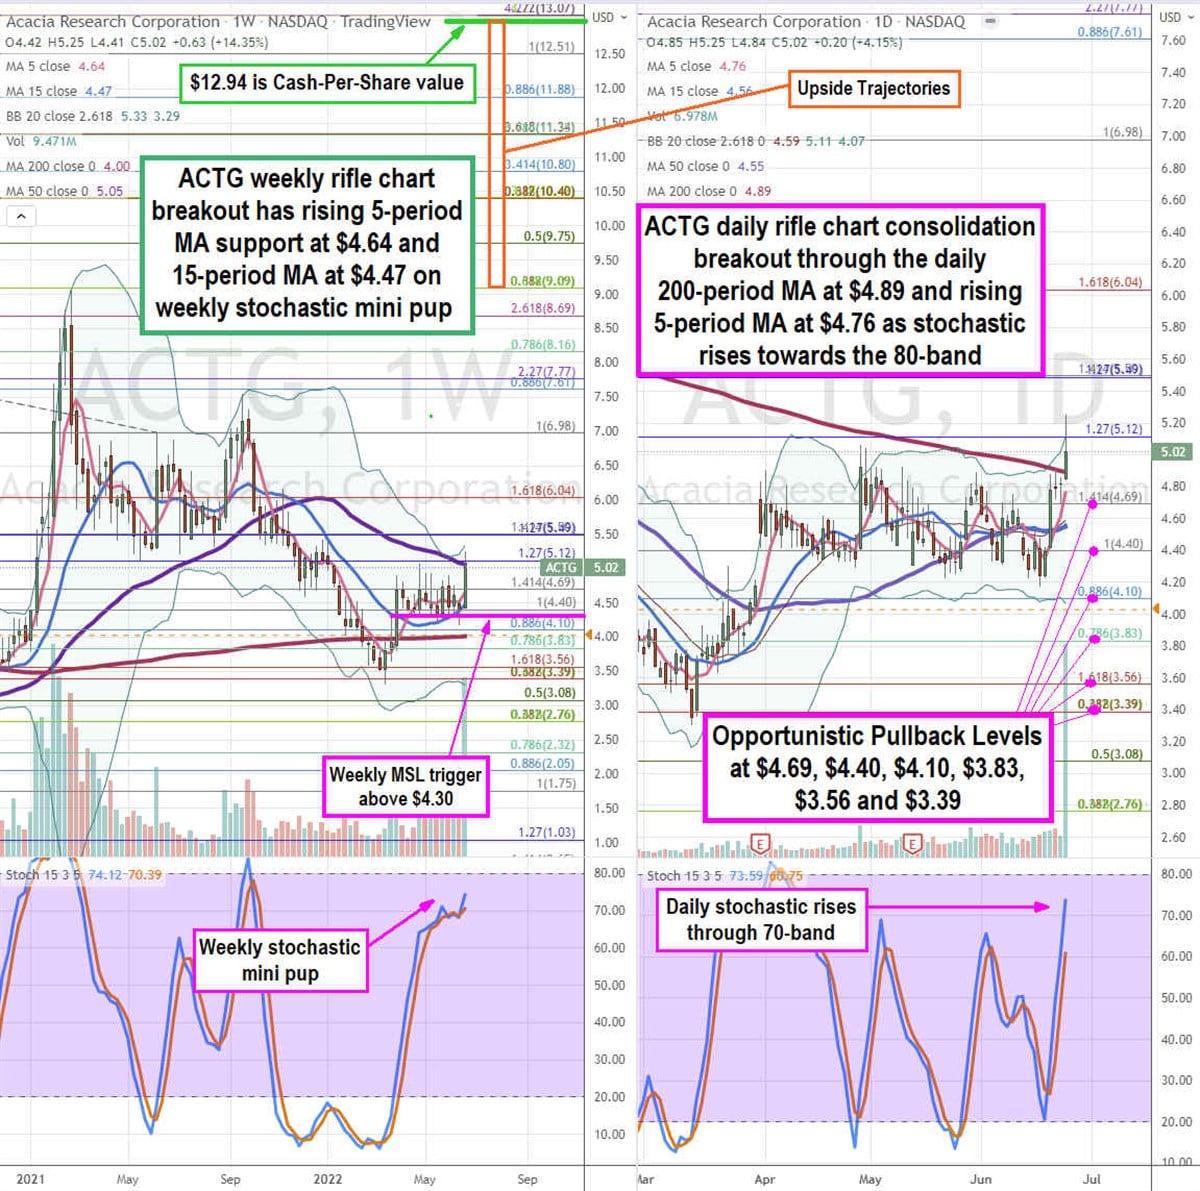
Using the rifle charts on the weekly and daily time frames provides a precision view of the landscape for ACTG stock. The weekly rifle chart bottomed near the $3.39 Fibonacci (fib) level before staging a rally to the weekly 50-period moving average (MA). The weekly 200-period MA support sits at $4.00. The weekly pup breakout has a rising 5-period MA support at $4.64 and 15-period MA support rising at $4.47. The weekly stochastic formed a mini pup through the 70-band. The weekly market structure low (MSL) buy triggered on the $4.30 breakout. The daily rifle chart is forming a Bollinger Band (BBs) expansion as upper BBs rising at $4.76. The daily 5-period MA is rising at $4.76 and 15-period MA at $4.56. The daily stochastic has bounced through the 70-band. Prudent investors can watch for opportunistic pullback levels at the $4.69 fib, $4.40 fib, $3.83 fib, $3.56 fib, and the $3.39 fib level. Upside trajectories range from the $9.09 fib level up towards the $12.94 cash-per-share value level.

