On-chain data shows the number of active Ethereum addresses has recently spiked up to a new all-time high. Here’s what happened in the past when the metric reached such high values.
Ethereum Active Addresses Surge To A New All-Time High
As pointed out by an analyst in a CryptoQuant post, a signal that has usually been bearish for the price of the crypto has gone off recently.
The “active addresses” is an indicator that measures the total number of Ethereum wallet addresses that showed some movement on any given day. The metric takes into account both senders and receivers.
When the value of this metric goes up, it means an increasing number of addresses are displaying some activity right now. Especially large values can be a sign of high activity from retail investors.
On the other hand, low values of the indicator suggest not too many Ethereum wallets are making moves at the moment.
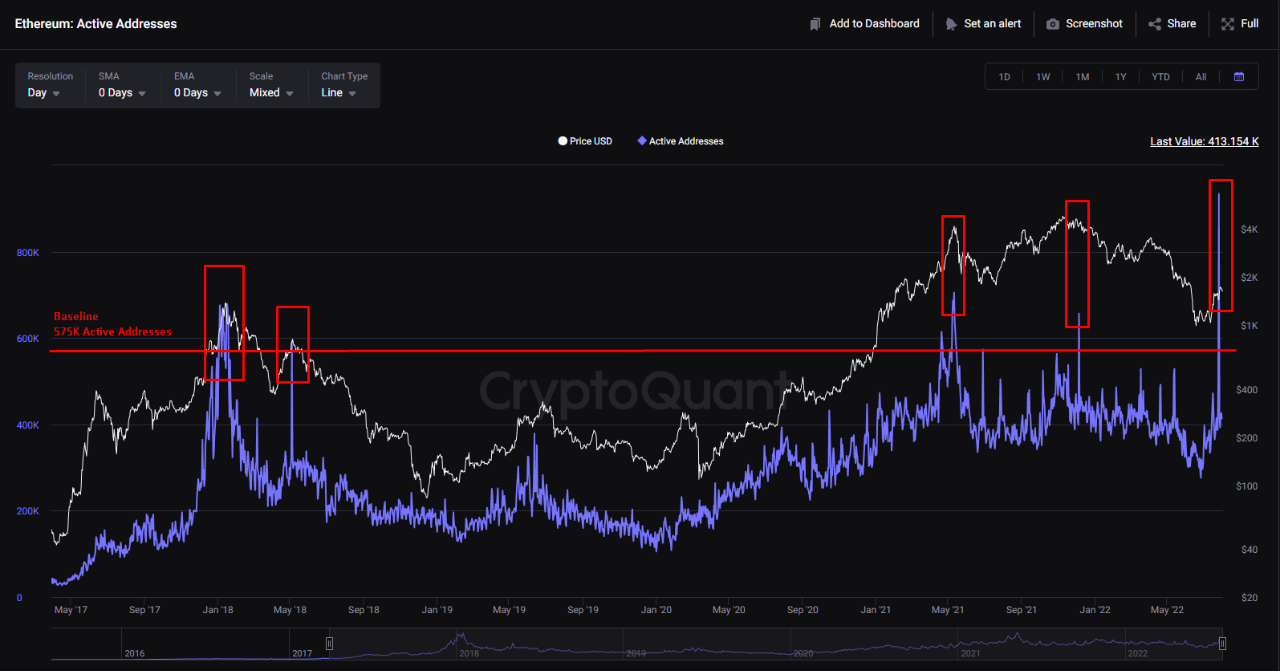
Now, here is a chart that shows the trend in the ETH active addresses over the last few years:

The value of the metric seems to have been pretty high in recent days | Source: CryptoQuant
In the above graph, the quant from the post has marked the relevant points of trend for the Ethereum active addresses.
It looks like whenever the indicator has risen above the “575k active addresses” level, the crypto’s price has registered a local top.
The metric has just recently observed a very sharp spike and set in a new ATH. The last all-time high occurred back in the 2017 bull run and coincided with the rally’s top.
If the past trend is anything to consider, then the latest surge to values never seen before may prove to be bearish for the coin this time as well.
Normally, one would think a large amount of addresses should instead be bullish as it shows high investor activity. However, the analyst believes it to not be the case.
The metric’s value gives hints about what kind of investors are active in the market right now. According to the quant, the latest surge could be coming from investors who are FOMO’ing into the crypto after learning about the merge and the recent upwards momentum that Ethereum has enjoyed.
ETH Price
At the time of writing, Ethereum’s price floats around $1.6k, up 14% in the last seven days. Over the past month, the crypto has gained 51% in value.
Below is a chart that shows the trend in the price of the coin over the last five days.

Looks like the value of the crypto has slid down over the last couple of days | Source: ETHUSD on TradingView
Featured image from Choong Deng Xiang on Unsplash.com, charts from TradingView.com, CryptoQuant.com


