On-chain data suggests the path to $2,500 could be open for Ethereum now that the asset has managed to cross the $2,100 mark.
Ethereum Has No Major Resistance Levels Until $2,500
In a new post on X, the market intelligence platform IntoTheBlock has provided an update on how the Ethereum levels are looking in terms of on-chain support and resistance. In on-chain analysis, ranges are defined as support or resistance based on how many investors acquired their coins inside them.
The below chart shows the density of addresses at various levels above and below the current spot price of the cryptocurrency:
The amount of holders that acquired their coins at each of the different ETH price ranges | Source: IntoTheBlock on X
Generally, whenever the Ethereum price retests the cost basis of an investor, they may be more likely to show some kind of move. When this retest happens from above, the holder may be inclined to believe the price will go up again soon so they may see the retest as a “dip” and thus, might decide to buy more.
Related Reading: Polygon (MATIC) Jumps Another 6% As Whales Show High Activity
On the other hand, the investor may want to exit the market if the retest is from below, as they might fear the price would go down again in the future, and by selling at the break-even mark, they would at least avoid incurring any losses.
A few investors showing such behavior is obviously not enough to cause any visible effects on the market, but if a large number of investors share the same cost basis, the asset could very well feel a sizeable reaction.
From the chart, it’s visible that there are some large cost basis centers below the current Ethereum levels, suggesting the presence of strong potential support ranges.
Earlier, when the asset had still been below $2,000, the $2,000 to $2,100 range posed as the last major resistance boundary to break. Since the coin has now risen above these prices, it’s possible that the range would be switching its role towards being support instead.
Following this latest rally, about 75% of the holders are now in profit (that is, their cost basis is in the levels below). As is visible in the graph, there are no price ranges with a high density of investors in the upcoming price levels, until the $2,500 mark.
“Does this mean it’s a clean run to a new ATH? Not necessarily,” explains IntoTheBlock. “Historically, profit-taking at these levels is common and leads to pullbacks. However, this is unlikely to significantly impact Ethereum’s long-term trajectory.”
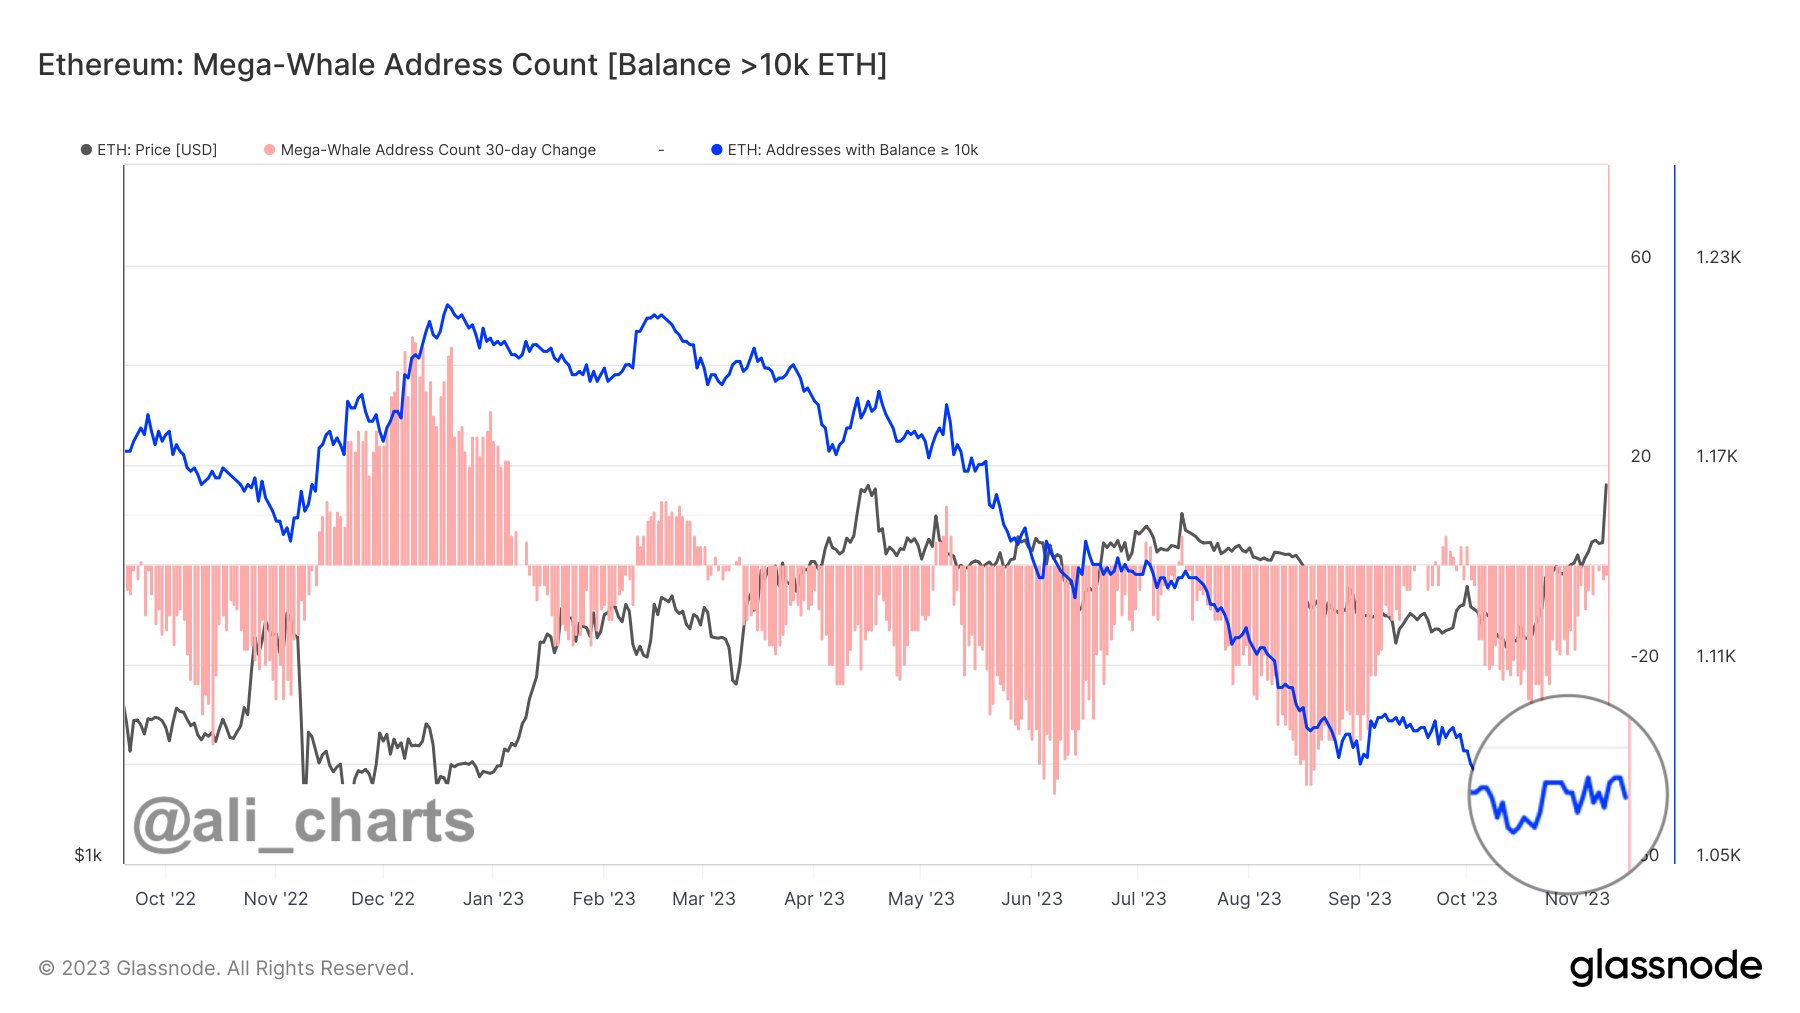
Analyst Ali Martinez has also pointed out something interesting in an X post today. He revealed that the latest rally in ETH has occurred without the support of the largest of the Ethereum whales (carrying a balance greater than 10,000 ETH), the so-called “mega whales.”
Looks like the value of the metric has been moving sideways recently | Source: @ali_charts on X
As highlighted in the graph, the total number of addresses owned by the Ethereum mega whales has been flat recently. “Ethereum has reclaimed the $2,000 threshold, and intriguingly, this is all happening before whales have even started buying ETH!” notes Ali.
ETH Price
After a surge of more than 9% in the past 24 hours, Ethereum has arrived at the $2,100 level for the first time since April.
The asset's price appears to have exploded during the past day | Source: ETHUSD on TradingView
Featured image from DrawKit Illustrations on Unsplash.com, charts from TradingView.com, Glassnode.com, IntoTheBlock.com


