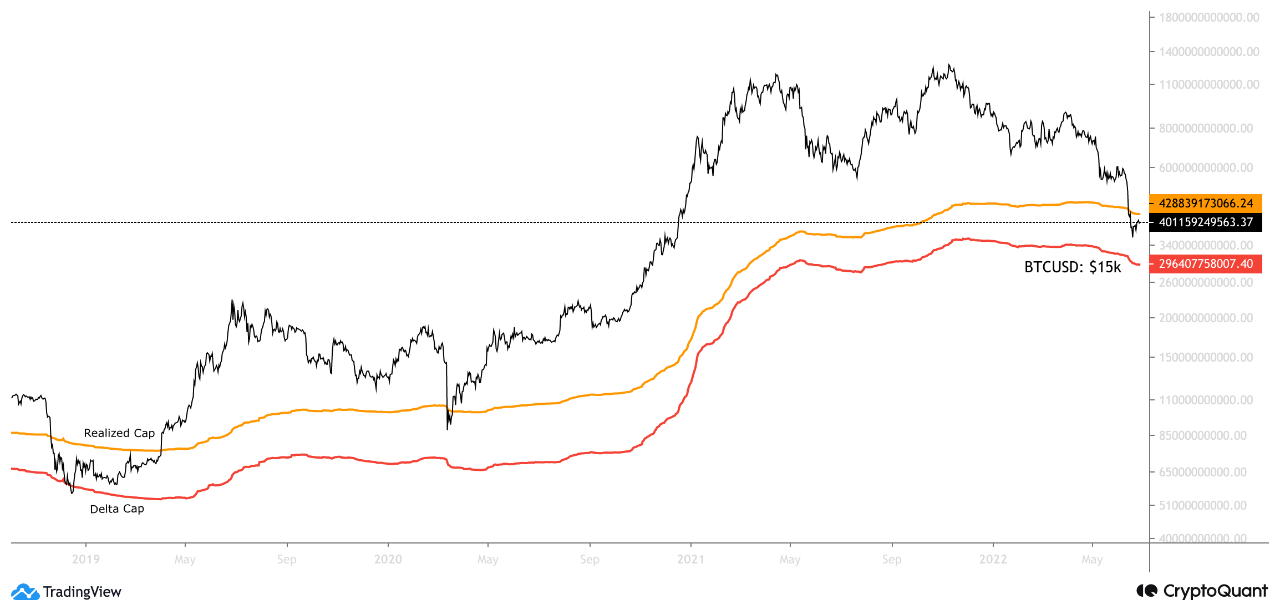
The “delta capitalization” model of Bitcoin may suggest that around $15k could be a possible bottom for the crypto’s price.
Past Delta Cap Trend Shows Bitcoin May Still Face More Decline Before A Bottom
As explained by an analyst in a CryptoQuant post, the BTC market cap is now below the realized cap, but still above the delta cap.
Before taking a look at the data, it’s best to first get a basic grasp of the three major capitalization models for Bitcoin.
The normal market cap is calculated by just taking the total number of coins currently in circulation and multiplying it by the price of BTC right now.
The “realized cap” works a bit differently; instead of multiplying all the coins by the same price, this model weighs each coin by the price it was last moved at.
Related Reading | USDC Exchange Reserves Rise As Investors Escape From Bitcoin
For example, if there are 2 BTC in circulation and the current price is $19k, then the normal market cap is simply $38k. However, if one of these coins was last transacted at, say, $15k, and the other at $19k, then the realized cap would be $34k instead.
Now, the Bitcoin “delta cap” is defined as the difference between the realized cap and the average of the market cap. The average of the normal market cap here is taken over the entire history of the crypto (and it’s naturally a moving average).
The below chart shows the trend in the different market caps for BTC.

The normal market cap still seems to be above the delta cap at the moment | Source: CryptoQuant
As you can see in the above graph, the Bitcoin market cap has recently dipped below the realized cap. However, it has still not gone down near enough to touch the delta cap.
Historically, the value of the crypto has formed bottoms whenever the market cap has been between the other two caps.
Related Reading | Fed Announces Inflation Warnings As Bitcoin Whales Remain In Wait Mode
In 2020, the coin bottomed out after the market cap went slightly under the realized cap, but in 2018 the metric even dipped a bit below the delta cap before the bottom was in.
This past trend may suggest that the point around the delta cap may be the possible lower bound for how deep the coin’s price can sink. And if so, then Bitcoin could potentially sink to or a little under $15k, before the current cap touches the delta cap and the bottom forms.
BTC Price
At the time of writing, Bitcoin’s price floats around $19.3k, down 9% in the past week.

BTC has gone down over the last few days | Source: BTCUSD on TradingView
Featured image from Dmitry Demidko on Unsplash.com, charts from TradingView.com, CryptoQuant.com


